IN THIS ARTICLE
Debugging PhysX
The PhysX system has the following features that you can use to debug issues.
Note:You must first enable the PhysX Debug gem.
Topics
- PhysX Debug Console Variables
- Debugging with the ImGui Tool
- Debug Options in the PhysX Configuration
- Enable additional checks and error reporting in PhysX SDK
PhysX Debug Console Variables
Enter the following console variables to debug your PhysX issues.
Sets your preferences for debugging. As a recommended best practice, enter this console variable command as your first step for debugging.
Example
physx_Debug 1
You can specify the following values:
1- Enable debug visualizations. By default, this value enables the collision shapes and edges for your PhysX entities.2- Enables all configuration options. This enables all the available visualization options.3- Toggles the proximity based collider visualization. This value applies only to mesh colliders. See Physics asset colliders.0- Disables debug visualizations.
Example
Toggles a visual culling box frame.
physx_CullingBox
Adjusts the culling box size to 100. Enter 0 to disable culling.
physx_CullingBoxSize 100
Connects to the PhysX Visual Debugger. You must have the PhysX Visual Debugger open to run this command. See Debugger Configuration.
physx_PvdConnect
Disconnects from the PhysX Visual Debugger. You must have the PhysX Visual Debugger open to run this command. See Debugger Configuration.
physx_PvdDisconnect
For more information, see Using the Console Window.
Debugging with the ImGui Tool
In game mode, you can configure the PhysX debug settings using the immediate mode graphical user interface (ImGui) tool.
Note:You must enable the ImGui Gem to access this tool.
To debug with the ImGui tool
Press Ctrl+G to enter gameplay mode.
Press the Home key to open the ImGui tool. The PhysX Debug menu appears under the Perspective viewport.
Click PhysX Debug.
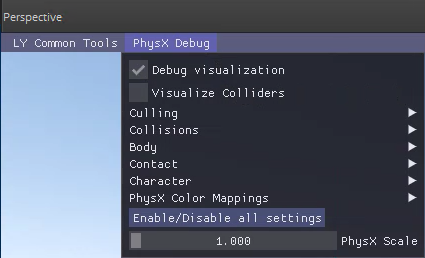
- You can make the following changes.
| Default | Description |
|---|---|
| Debug visualizations | Enables debug visualizations mode. This is the same as the physx_Debug 1 console variable. |
| Visualize colliders | Enables colliders to appear. This is the same as the physx_Debug 3 console variable. |
| Culling | You can specify the following options:
|
| Collisions | Enables debugging for collision types. You can specify the following options:
|
| Body | Enables debugging for body types. You can specify the following options:
|
Debug Options in the PhysX Configuration
You can also specify debug settings in the PhysX Configuration tool. See Debugger Configuration.
Enable additional checks and error reporting in PhysX SDK
You can make the profile configuration of O3DE use the checked version of the PhysX SDK library. PhysX will perform additional checks to detect invalid parameters, API race conditions and other incorrect uses of the API which might otherwise cause mysterious crashes or failures in simulation. The benefit of doing this is the same safety checks from the debug configuration are enabled without having to run O3DE in debug, where low framerates could impact the simulation.
Using the checked version of PhysX has an impact on performance. Use it to detect errors in the simulation or to make sure that the scene is properly set up, but disable it when doing profiling or trying to identify performance bottlenecks.
You can enable the checked version of PhysX by setting LY_PHYSX_PROFILE_USE_CHECKED_LIBS to TRUE during CMake configuration:
-DLY_PHYSX_PROFILE_USE_CHECKED_LIBS=TRUE